 Shutterstock
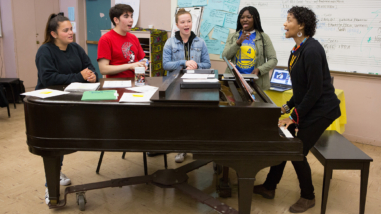
Pat Wayne is the program director at CreateCA, California’s statewide arts coalition, and a grantee of the Hewlett Foundation. Her organization launched a new project to help increase participation and ensure student success in arts education by providing a set of tools that shows exactly where and what arts classes are offered across the state. I spoke with her recently to find out how the project is going.
What is the California Arts Education Data Project?
The California Arts Education Data Project is a first-of-its-kind effort that analyzes and reports school-level data on arts education courses and enrollment for grades six through 12 throughout the state.
Presented in a user-friendly, color-coded dashboard, the project provides important information for education leaders, teachers and parents about levels of access to and enrollment in arts programs in schools. New Jersey piloted a similar program three years ago and California is the first state to launch in a four-state cohort that also includes Wisconsin, Ohio and North Carolina.
What do the data show?
The dashboard allows users to review school-level, district, county and statewide data and presents the statewide averages as the baseline for comparison. It reports data from 2013–2014 and 2014–2015 from 3,719 schools, covering more than three million students in grades six through 12, which is roughly half of California’s student population.
The data show that nearly 97% of students have access to some level of arts education, but only 26% of students have access to all four arts disciplines of dance, music, theater and visual art as required by the state education code. Also, 86% of schools provide at least one arts discipline, but only 12% of schools offer the four required arts disciplines.
Do any trends stand out for you?
It surprised me that only 38% of students were enrolled in at least one arts discipline, so we definitely need to increase participation rates. Further disparities exist by discipline, with 17% of students enrolled in art, 14% in music, 5% in arts, media and entertainment, 4% in theater and 2% in dance.
I think it is incredibly important to note the inequities in access and participation. The data show the greater the percentage of students on free and reduced lunch, the lower the arts participation rate. In addition, the data indicate that the proportion of students without access to any arts courses was greater where the majority of students in the school are either African American or Hispanic when compared to the total student enrollment distribution. Although schools with no arts courses tend to be in rural areas, the greatest concentration of students without access to arts is in large cities.
How do you hope the data will be used?
Data is an important tool to improve outcomes and until now there have been few opportunities to analyze arts education data in a coordinated effort. We are offering districts some help to have the critical discussion and make progress by creating strategic arts plans.
In fact, the first effort across the state happening right now is to look at the data reflecting the last two years and make sure it has been accurately submitted by the districts to the California Department of Education (CDE). We’ve heard from some districts that after seeing the data shared publicly online, they realized that they weren’t properly accounting for all their art offerings in their reports to the CDE.
And it’s important to note that this is just the first year of an ongoing effort. Districts will update their data annually in October and then have time to ensure that data is correct, before it is made public each spring.
We hope to be a partner to districts. The resources available to them are detailed in our Roadmap for Districts, which can be accessed on the homepage of the data project.