Demographic snapshot of U.S. grantees: Preliminary findings

Credit: Arthimedes/Shutterstock

Last year, the Hewlett Foundation began collecting information about the demographic makeup of our grantees—the latest chapter in an ongoing, institution-wide effort we began in 2013 to improve our practices regarding diversity, equity, and inclusion (DEI). Having started with internal operations and workplace culture, we had already begun tracking and publicly sharing our board and staff demographics when we realized that we knew next to nothing about the demographics of the boards and staffs of the organizations we support.

It’s something we should know, because it matters. The choice to award our finite grant dollars to some organizations (and not others) empowers those organizations and confers reputational and other intangible benefits. These choices are guided by the foundation’s grantmaking strategies, which is to say by the judgment of program staff about which organizations will most effectively advance those strategies. And, as with any and every choice, we have an obligation to do our utmost to identify and eliminate implicit biases that may unfairly distort or otherwise affect the selection process. Yet we cannot do that, cannot even know whether or where such biases are found, without knowing what our grantee pool looks like.

It is important to understand this point, which shapes both how we are collecting demographic information and how we will use it. Our purpose is not to change the internal operations or hiring decisions of organizations that seek our support, and no individual grant decision will be made or affected based on what we learn. Indeed, we are taking pains to ensure that program staff do not even have access to the data of individual organizations that seek or receive grants. Our purpose, rather, is to examine the outcomes of our selection process in the aggregate to detect whether structural or implicit biases may be affecting our decisions, and, if so, how.

A first, but incomplete, effort

We made an initial stab at collecting this data in 2018, using a survey administered by Harder + Co. Community Research. The survey asked about the boards, staff, and senior leadership of grantees that were active as of November 2017. We excluded non-U.S. grantees on the understanding that other countries and cultures may have very different questions and concerns when it comes to DEI, and we sought only information about race/ethnicity and gender, rather than the full panoply of demographic traits that we acknowledge are important. Given the complexities involved, we thought it best to keep our first attempt modest and to determine whether and how to enlarge the effort once we have some experience collecting and using demographic data.

As surveys go, Harder’s received a terrific response, with very nearly two-thirds of our U.S. grantees participating. Organizations representing a broad range of nonprofits across all our programs responded—from local Bay Area arts organizations, to national advocacy groups, to global research organizations, from small organizations with budgets of less than $500,000, to large institutions with annual budgets exceeding $20 million, to everything in between.

But while this may be a very strong response for a survey, it’s still the case that more than a third of our grantees did not take part. Among those who did, moreover, not all answered every question; response rates dropped for key questions. Lacking reliable information about selection effects—about whether and what systematic differences there may be between responding and non-responding grantees—the resulting portrait is incomplete in ways that make informed and accurate conclusions impossible. We need something more comprehensive, something more like a census than a sample.

To that end, the foundation is initiating a new process for collecting data, beginning this quarter. Grant dollars will not be released to successful applicants until they complete a demographic survey, though the survey includes an option to decline to provide information. Grantees that receive multiple grants or whose grants are renewed need not repeat the survey or update their information more than once every three years. The survey will still be administered independently from our grantmaking processes, and program staff will still not have access to the results of any individual organization. Aggregate results will be reviewed by the president and program directors each year, along with other efforts to ensure a diverse and inclusive grantee pool, as part of our annual strategy review process. We will do a comprehensive analysis and public report every three years. The results of the 2018 survey will be included in the new effort, so grantees that completed last year’s survey need not do so again until 2021.

What we’ve learned so far

We may not be able to draw actionable conclusions from last year’s survey, but we still learned a great deal from doing it. Most important, we learned how difficult it is to assess the information we gathered. What does it mean for an organization (as opposed to an individual) to be “diverse”? We collected data about boards, senior leadership, and staffs. But what if, as is typically the case, each is diverse to some extent, but in different ways and to different degrees? And since our focus is on aggregate results, not individual organizations, how do we manage the very practical problem of analyzing these different dimensions across hundreds of grantees?

In the end, we had to look at the data in multiple ways to make sense of it. Below, we include a few of the most useful depictions: three scatter plot charts that show how grantees are distributed across several dimensions. (You can see the many other ways we examined the data in the full report.) Fortunately, since we collected this data to expose patterns in our aggregate grantee pool—looking to spot gaps or deficiencies that suggest flaws in our selection process, rather than shooting for specific targets or numbers—the cumulative information conveyed by the different representations should suffice for our purposes (once we have more complete data, that is).

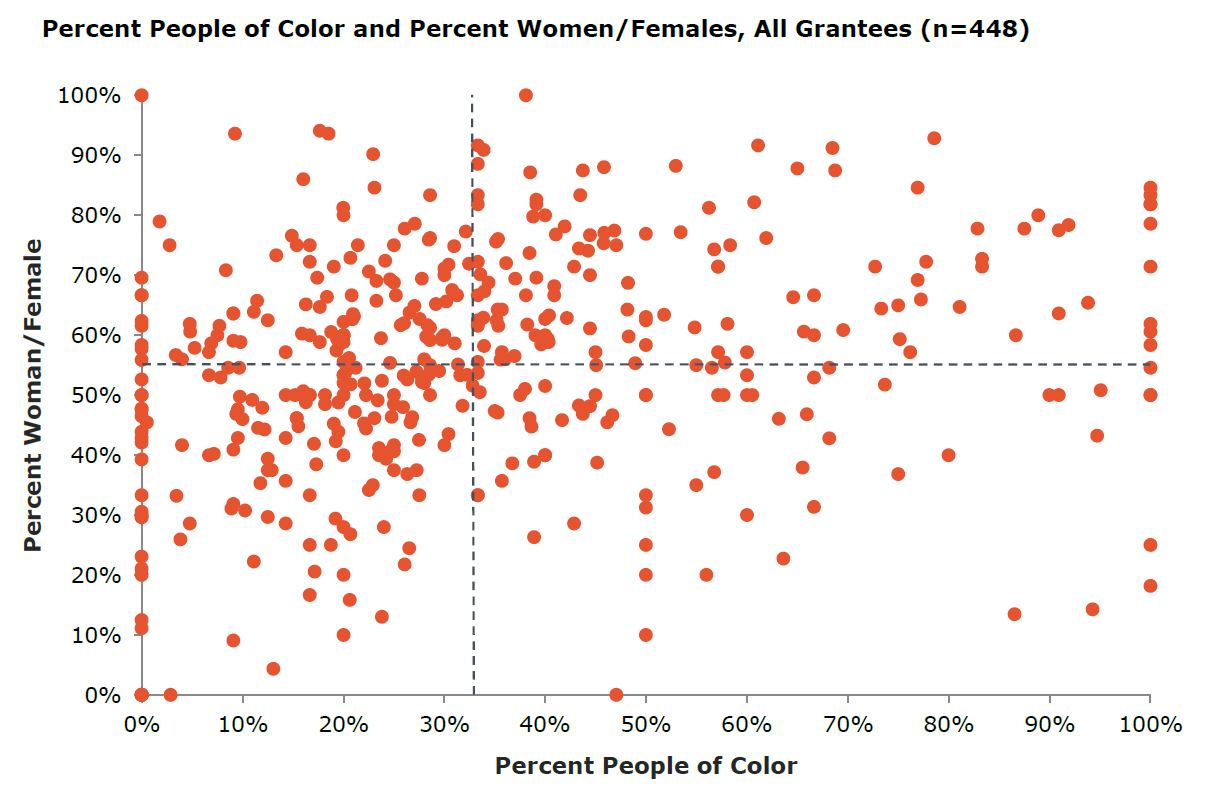
Dotted lines represent mean percent of women/females (55 percent) and people of color (34 percent) across board members and all staff for all grantee organizations. This chart includes the percent of people of color and percent of women/females across all four people types from whom we collected data (board members, head(s) of organization, senior staff, and other staff. (Source: Harder+Company Community Research)

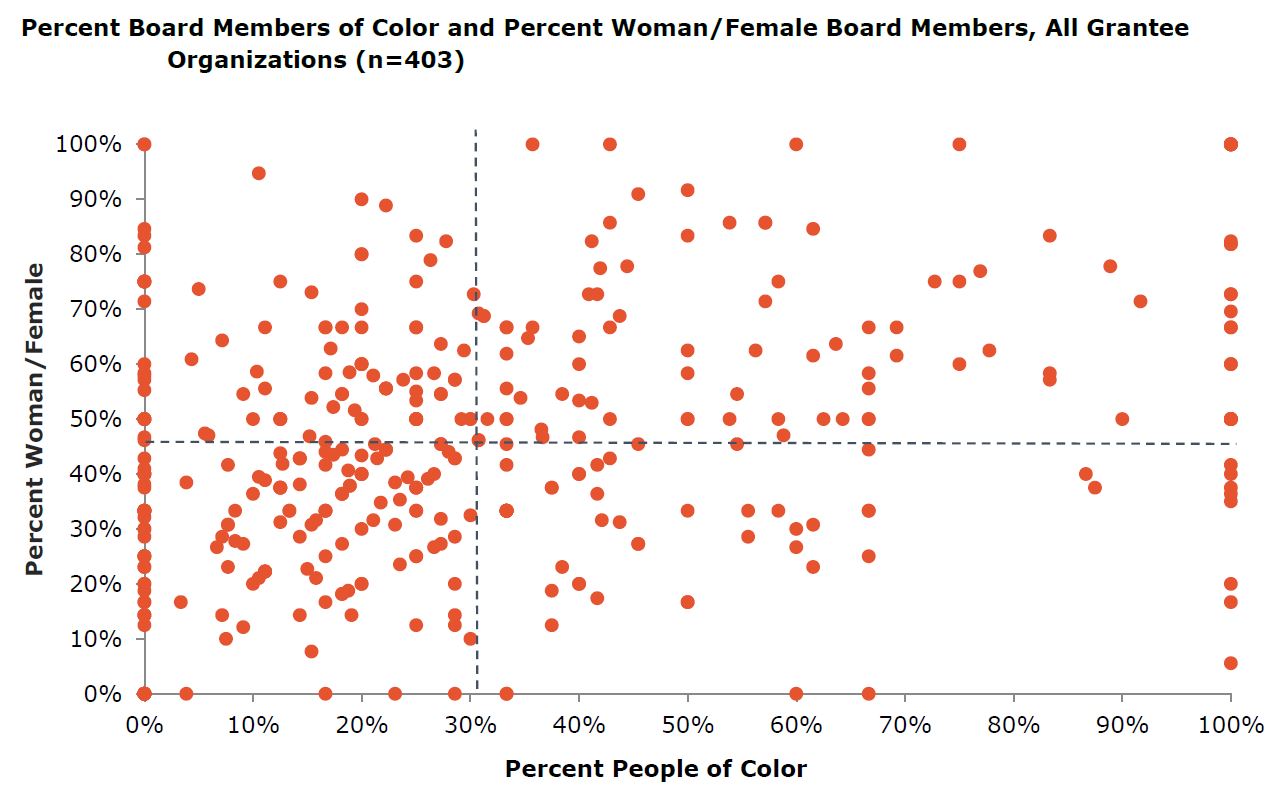
Dotted lines represent mean percent of women/females (46 percent) and people of color (31 percent) across board members for all grantee organizations. (Source: Harder+Company Community Research)

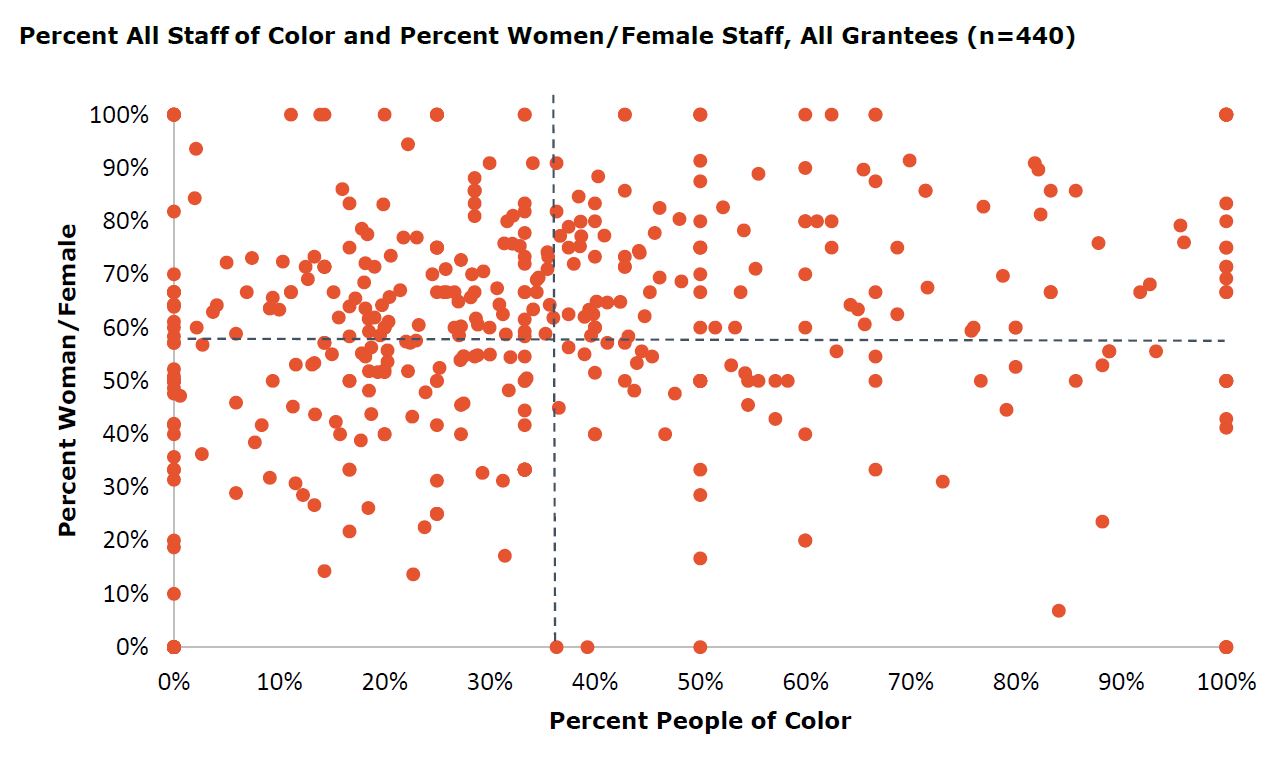
All staff is defined as an organization’s head(s) of organization, senior staff, and other staff; board members are not included in the all staff count. Dotted lines represent mean percent of women/females (57 percent) and people of color (36 percent) across all staff members for all grantee organizations. (Source: Harder+Company Community Research)

While we cannot assess whether last year’s survey provides an accurate portrait without data on the missing third of our grantees, the results are nevertheless suggestive and, in some ways, not wholly surprising. Consider a few figures:

  • Across the foundation’s programs, the staffs of grantees that completed the survey consisted on average of 36 percent people of color and 57 percent women.
  • Grantees reported that an average of 31 percent of their board members are people of color, while 43 percent are women.
  • Among grantees who completed the question, only 24 percent are headed by someone who is not white; there is greater gender parity, with 49 percent of grantees reporting a female head of organization.
  • Looking at senior staff more generally, across all grantee organizations, 68 percent of senior staff are white, and 61 percent are male.

For context, the Census Bureau reports that the overall U.S. population (including children, not just working-age adults) is roughly 60 percent white, 40 percent non-white, and 50 percent male, 50 percent female. But is overall population the right benchmark to use in assessing the scope and nature of any shortfalls? Should it depend on the field? Or on the population we are seeking to benefit? Should the point of reference be different when work is local or regional instead of national? And should we settle for outcomes that resemble existing demographics? How good is “good enough”? These are among the many questions we’ll be grappling with as our data improves and we begin to consider next steps.

Whether we find glaring gaps or deficiencies, we know we need to improve, and we know we can and must do better. Program staff are already exploring ways to broaden their networks and reach leaders and organizations we may be overlooking. All our programs have recognized that supporting more diverse organizations will enhance their ability to achieve their strategic goals, albeit in different ways depending on the strategy; several have revised their strategies to incorporate equity concerns into the goals themselves. We have, meanwhile, launched a pilot program to provide organizational effectiveness grants to existing grantee organizations that want to improve their own DEI practices, as well as a new initiative that focuses on developing diverse leaders.

Much remains to be done, but it is clear we can do it better if we have better information. Stay tuned!

Download the full report (PDF)

The survey was fielded by Harder + Co. Community Research. It was distributed by email in January 2018 to more than 700 U.S. grantees who were active as of November 2017. Questions and response choices drew upon publicly available sector standards. A working group of staff from across the foundation’s programs provided input on the survey design. To place minimal burden on grantees, respondents were given the option to share information in the form closest to how they originally collected it. See the report for complete results and more details about methodology.

Search Our Grantmaking


By Keyword