As part of our commitment to openness and transparency, the Hewlett Foundation shares data about the demographics of our staff and board, as well as our grantees.
Staff Demographics
The data below are drawn from surveys of the Hewlett Foundation staff, who number approximately 130 people across program, administrative, and investment teams, all based in the San Francisco Bay Area.
Categories for gender and race reflect how individuals self-identify. In recent years, the foundation has expanded its survey to include additional aspects of identity so that staff can participate more fully. This includes options to choose multiple categories and new questions related to race and ethnicity, and expanded categories and questions for gender identity, orientation, and ability.
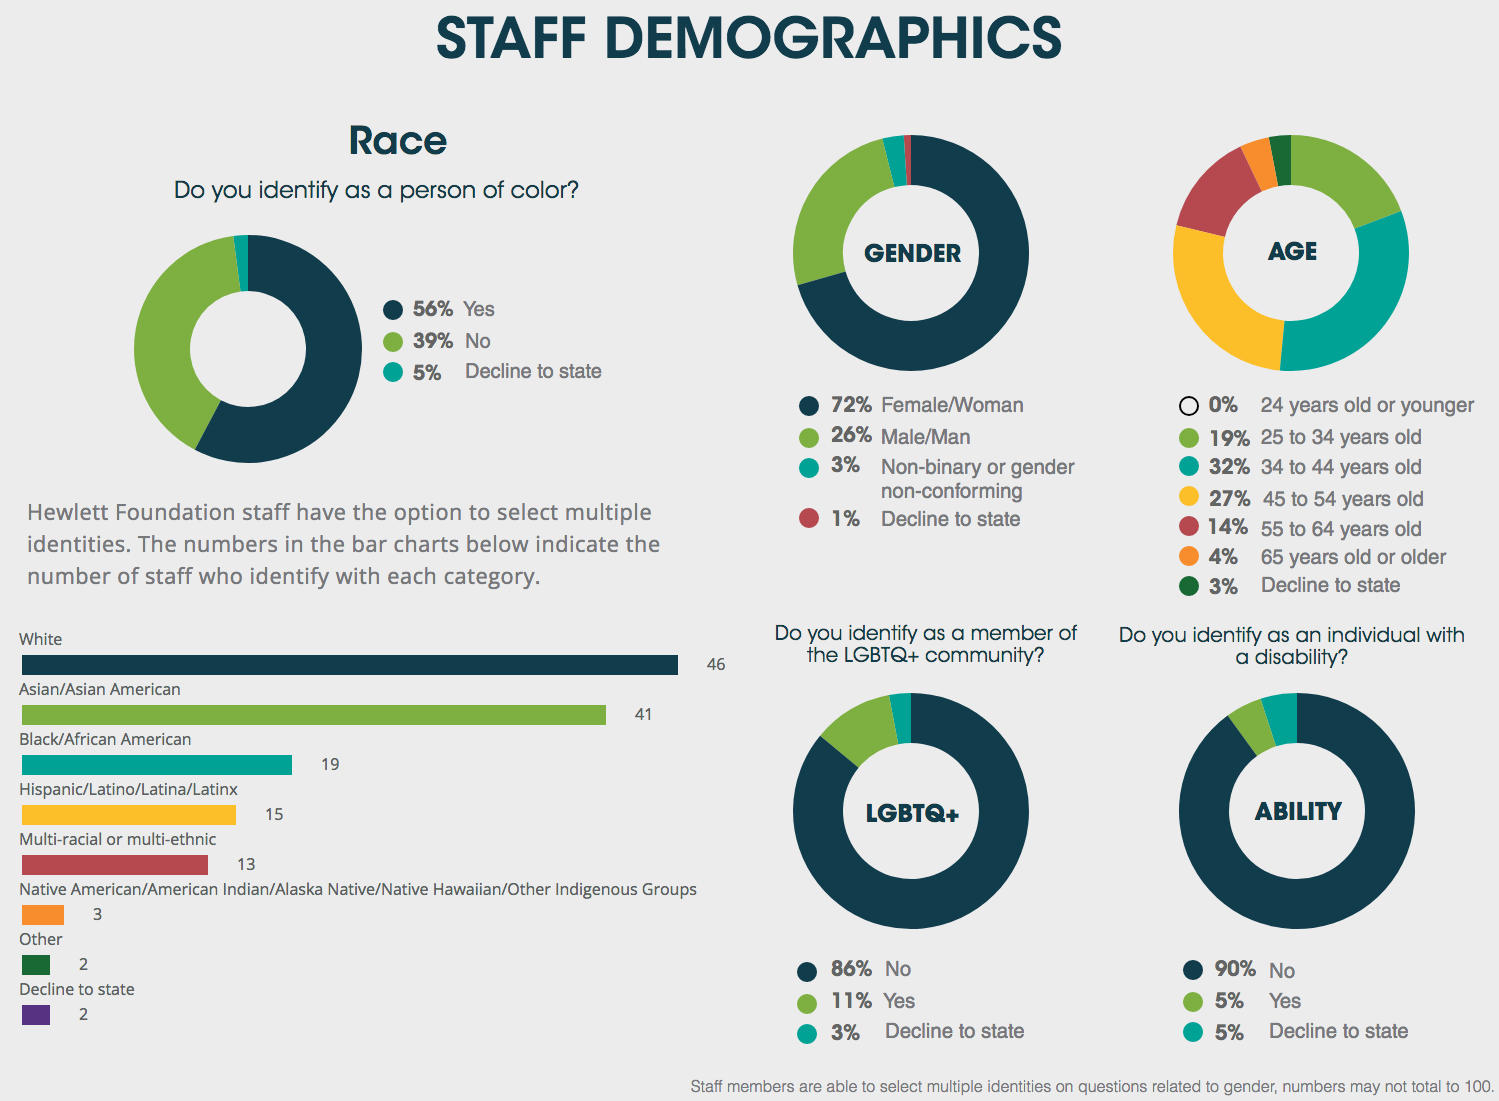
In keeping with the changes in research best practices, the foundation in 2021 added a question to specifically ask if staff self-identify as a person of color. As of June 2023, 56% of the foundation’s staff self-identified as a person of color, 39% did not, and 5% declined to state, continuing a trend of racial diversification among both staff and senior staff. For example, in 2016, 39% of staff identified as non-White and 59% as White, and four years earlier, 31% of staff identified as non-White and 69% as White. And as of June 2023, 69% of senior staff identified as a person of color, whereas in 2021, 43% of senior staff identified as a person of color. More specifically, among senior staff: 31% identified as White, 31% as Asian/Asian American, 19% as Black/African American, 13% multi-racial or multi-ethnic, and 6% as Hispanic/Latino/Latina/Latinx.
Trends related to gender have changed slightly among the staff overall. As of June 2023, the foundation’s staff is 72% female, 26% male, and 3% non-binary or gender non-conforming, and 1% declined to state; in 2016, the staff was 73% female, and 27% male. And in 2008 — when we began collecting this data — it was 75% female, 25% male. The senior staff is 63% female and 38% male, roughly unchanged from the year before where 60% was female and 40% was male.
In 2023, 11% of overall staff identified as a member of the LGBTQ+ community, 5% identified as a person with a disability, and 3% of staff identified as non-binary or gender non-conforming. On senior staff, 13% identified as a person with a disability and no senior staff member identified as a member of the LGBTQ+ community or as non-binary.

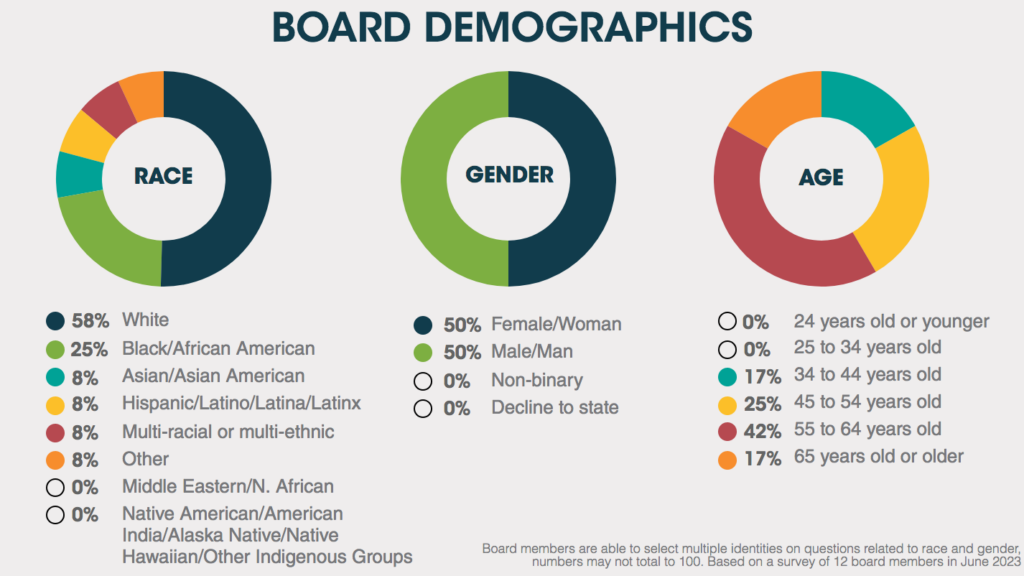
Board Demographics
The Hewlett Foundation board comprises 12 members, excluding the president. As of June 2023, 42% of board members self-identified as a person of color and 58% did not; six years earlier, the board was 31% non-White and 69% White. As of June 2023, the foundation’s board is 50% male and 50% female; whereas in 2017, the board was 69% male and 31% female. In the 2023 survey, 8% of the board identified as a person with a disability and no board member identified as a member of the LGBTQ+ community or as non-binary.
In 2011, the foundation adopted new policies related to board membership. Four board members must be linear descendants of William and Flora Hewlett; there must be at least five but no more than 11 additional, independent board members. All but one of these board members serve three-year terms, with a limit of four terms. One of the family slots is for a “special director,” typically from the next generation of Hewletts, who serves a single two-year term.