2015 marked the mid-point of our current Performing Arts strategic framework, which runs from 2012-2017, and lays out the goals of our grantmaking, as well as measures for how we’ll evaluate our progress. In order to get a view into how we’re doing, last year we engaged two consulting firms, Informing Change and Olive Grove, to conduct an assessment for us. I won’t keep you (or our grantees) in suspense: the headline is that we’re making progress on the goals we set for our program when we adopted the strategy—thanks, of course, to the wonderful, creative, innovative work that our grantees are doing—and while there are certainly areas where we feel we can improve, we aren’t planning any major shifts in our grantmaking in the near future.
The assessment, which we are sharing publicly today, shows that “from 2011-2014, total participation in grantees’ performing arts activities, including performance, events, workshops, and classes, grew by 33%, from 10.3 million to 13.7 million,” which is well above the modest growth goals we set in the original strategic framework. While evaluating progress in our arts education grantmaking was somewhat more difficult because the available data does not track perfectly with what we want to measure, the research showed that “[California] K-12 enrollment in arts courses increased from 1.3 million in 2012-13 to 1.4 million in 2013-14 with all ethnicities except White and Asian/ Pacific Islander meeting the growth target of 1%.”
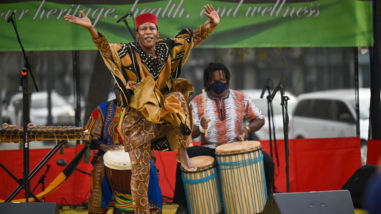
A key question for us in commissioning this assessment was which geographic and demographic communities have benefitted from Hewlett Foundation support and where are the gaps? The answer to that question is slightly more complicated than the topline results. We are seeing an increase in the percentage of grantees working with diverse communities across three metrics that we track internally: organizations led by and serving historically marginalized and under-resources communities (which we call “California diverse” in tracking); those whose artistic product is rooted in and reflective of a historically under-resourced or marginalized form, expression, or community (“culturally specific”); and those with an operating model rooted in and reflective of a historically under-resourced or marginalized community (“community-based”).
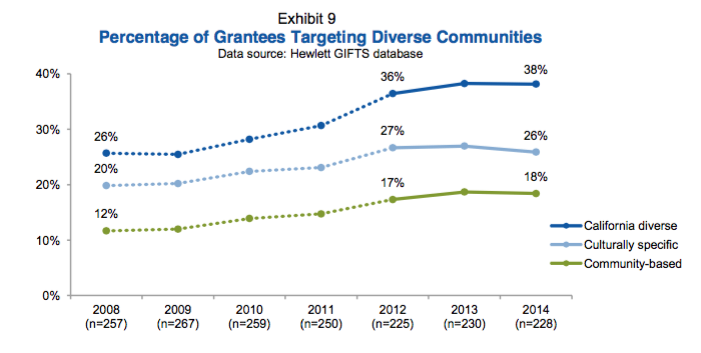
There is, of course, a great deal of overlap between these categories, and many grantee organizations fall into more than one of them. What’s important, though, is the overall trend, with more of our grantmaking over time going to these organizations, an important part of our goal of supporting both “traditional works from multiple cultures that reflect the diversity of the San Francisco Bay Area and innovative works that represent emerging cultural expressions.”
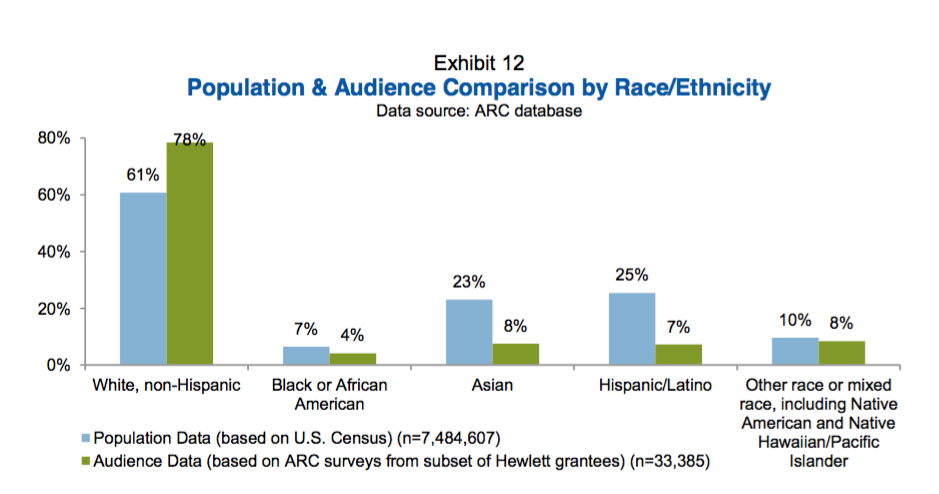
But keeping pace with the increasingly diverse Bay Area remains a challenge, and data from an audience research project we supported for a group of our grantees—the Audience Research Collaborative (ARC)—shows where we still have work to do. It’s important to note that the survey methods used may introduce bias towards more White, female and highly educated respondents, and that this is a data sample taken from only one third of the grantees we categorize as part of our Continuity and Engagement grantmaking strategy—it does not include data from any of our Infrastructure or Arts Education grantees. What’s more, U.S. Census categories themselves have not kept pace with rapid demographic change, and don’t reflect the true diversity of our society, something many participants in ARC addressed by collecting data about both the census categories and expanded categories that better reflect the communities they serve—to track gender, for example.
Having said that, the data shows ARC participants’ audiences to be more White than the Bay Area as a whole—78 percent of our audience indicated “White, non-Hispanic” in audience surveys versus 61 percent across the Bay Area—and that both Hispanics/ Latinos and Asians are underrepresented among racial/ ethnic groups.
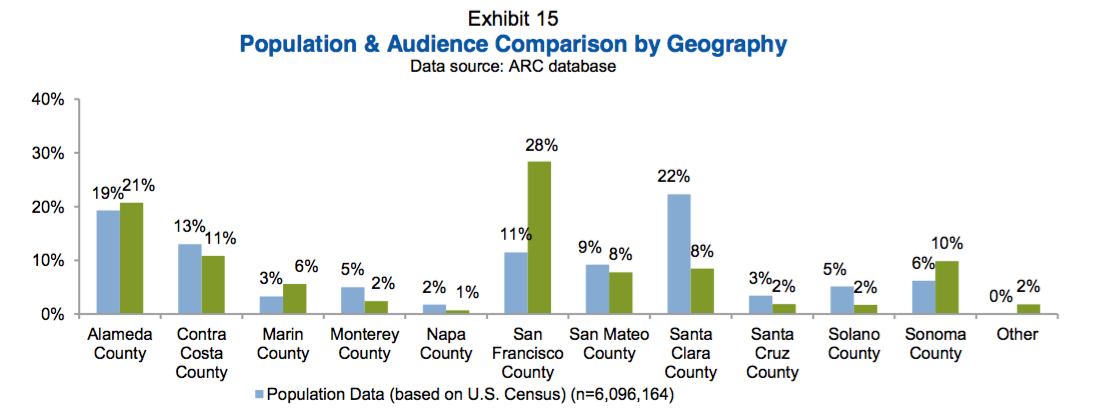
At the same time, the geographic reach of our grantmaking is reflected in ARC participants’ audience demographics, with San Francisco residents considerably overrepresented, and Santa Clara county residents underrepresented, as our some of the more rural Bay Area counties, such as Monterey, Solano, and Santa Cruz.
We continue to try to find new ways to ensure our grant dollars are reaching arts organizations and audiences who are representative of the Bay Area overall. Our support of regranting organizations, who provide our funds to smaller organizations reaching historically marginalized or more remote geographic communities is one way we are trying to expand our reach. This includes our ongoing partnerships with local arts councils, community foundations, commissioning funds, and arts service organizations.
There is a great deal more information about our grantmaking and the audiences our grantees are serving in the midterm assessment report. I encourage you to read the whole thing. And of course we welcome your questions and comments about the findings. We pair this assessment with the recent anonymous feedback from our Grantee Perception Report, conducted by the Center for Effective Philanthropy—we are grateful to the hundreds of grantees that provided input to us through that survey. As I wrote at the beginning of this post, we are achieving the goals we have set for ourselves thanks to the wonderful work of our grantees, and we will continue to look for ways to ensure that our support is sustaining artistic expression and encouraging public engagement in the arts for the benefit of everyone in the San Francisco Bay Area.